
Data Storytelling with Stornaway

Gain powerful engagement insights, discover attitudinal change and understand learning behaviour using interactive video with Stornaway.

The possibilities are endless! 🚀

The true power of interactive content lies not only in its ability to engage but also in the insights it provides.

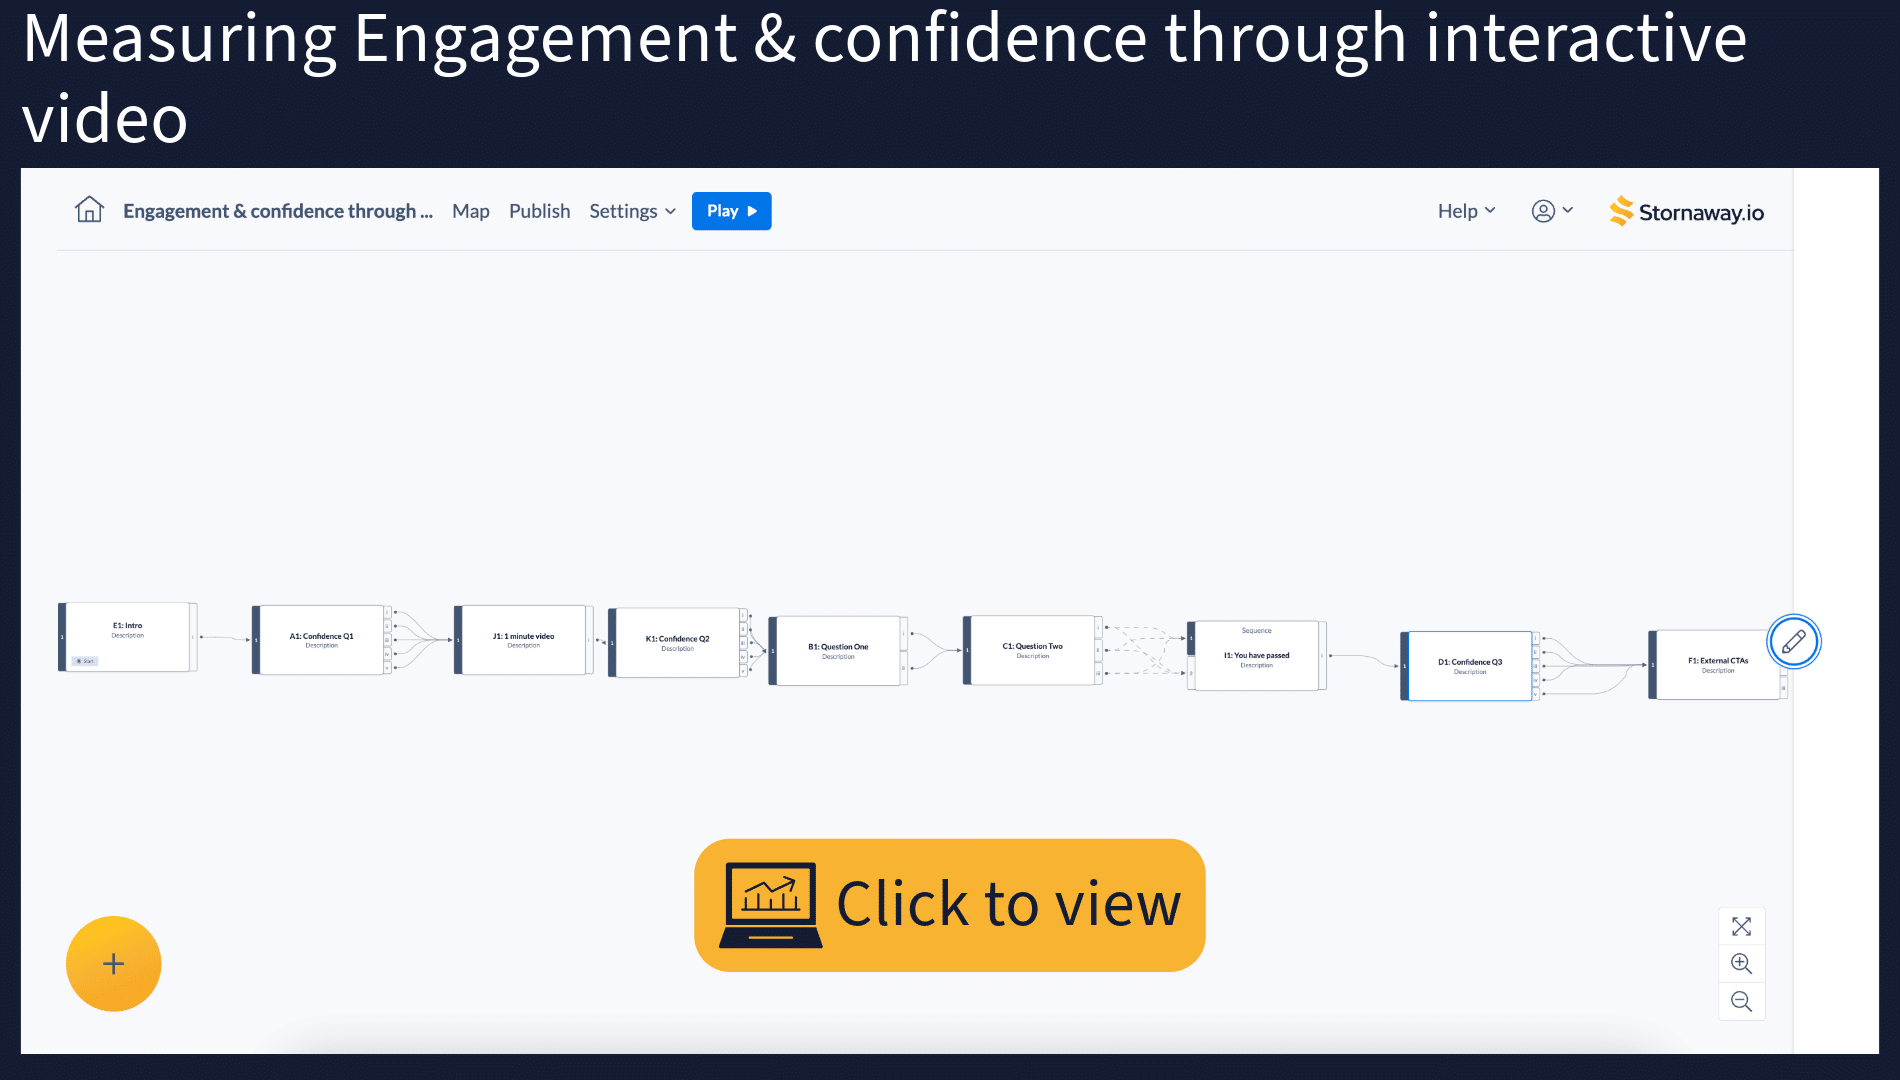
Using the Stornaway API, you can track and measure data that is relevant to you. Gain insights into viewer behaviour and learning, or analyse engagement and retention across your journey – anything is possible!

Best of all, our API is completely flexible, security compliant and can integrate with any platform you use to record user data so you can map your data to specific users or segments.

Take it one step further and send that data to any analytics or visualisation tools you use to really get into the detail and examine trends.

Create educational experiences to challenge the attitudes on a complex topics and measure change

Interactive video is a powerful tool when it comes to measuring change – whether that’s viewer knowledge or confidence or the overall impact of the video – our API will allow you to analyse this to gain important insights into viewer behaviour across the journey.

By asking viewers their attitude or confidence at the start of your video, and again at the end after watching the educational films or resources, you can measure how their knowledge and understanding has changed through engaging with your interactive experience.

Creative Agency Tilt, were tasked with creating an interactive educational experience that would challenge the attitudes of millions towards drink driving.

Read the Case Study

Discover friction points to improve engagement

To ensure you’re getting high levels of engagement and good results from your interactive video, it’s important to understand where viewers may lose interest or struggle to complete a part of your journey.

Using our API to track and analyse viewer behaviour at each stage of your journey, you can gain insights into where users drop off, encounter friction or face obstacles that prevent them from progressing further.

This information can be used to A/B test different versions of your project and iterate improvements along the journey to help optimise user experience and conversion rates.

Optimise your CTAs to drive engagement and conversions to maximise impact

In the realm of interactive video, Call-to-Action (CTA) buttons serve as pivotal elements that guide viewers and potential customers through your funnel. Measuring the effectiveness of CTAs within your interactive videos, will allow you to optimise for higher conversion and click through rates.

By measuring the impact of CTAs, you can gain valuable insight into user behaviour, preferences, and the effectiveness of your content so that every interactive element resonates with your audience.

The placement and design of these CTAs can significantly influence viewer engagement and conversion rates. For example, by identifying a CTA that isn’t getting many clicks and adjusting wording, design or placement within your video, you can use data-driven decisions to significantly impact your video’s success.

Assess video engagement by measuring watch time

Video watch time is an important metric to measure when it comes to understanding viewer engagement in your interactive video. Going beyond view count, this measurement will tell you the quality of your views.

Once people started watching your video, using our API, you can work out whether your audience is engaged enough to watch it in its entirety, or whether you lose them at a specific point resulting in viewers moving on without watching the rest.

This key engagement metric can tell you how well your message resonated with your audience, allowing you to tweak and refine using the data you gain.

Getting into the detail 🔎

How Stornaway collects data

We do not store any personally identifiable information about viewers including using any cookies or trackable data about individual sessions. Your account will show an anonymous overview of all the choices people have made in a Stornaway project – you can learn more about our analytics dashboard here.

Instead, we leave the recording and storing of session data up to you! Whether you’re embedding your projects on a website or LMS, our API gives you full control over how you collect and manage user data when releasing your projects. This gives you complete flexibility and power over the metrics you want to track and how best to visualize that data.

All about the Stornaway API

Our JavaScript API lets you react to viewers progressing through your story, e-learning course or interactive video, as well as control its playback.

Anything is possible – the important thing is to decide what meaningful metrics you want to store, what system you want to store them in and how the users will be identified on your side.

All that’s needed is some simple javascript to sit alongside the player on your web page or LMS, listen to what’s happening when the user is playing the project, and send the relevant metrics to your system, associated with the user ID on your side – without any of it touching our servers. It’s incredibly flexible, and privacy compliant.